
137K active wallets
25.5K delegators
Below are sources and numbers of Harmony’s growth and competitor analysis.

users bridge: assets, accounts, txs nft: sales, assets, artists exchanges: assets, transactions, volume wallet: mau, dau, downloads
economics dapps: deploys, transactions, accounts staking: validators, delegators, tokens token: rank, price, full cap
engagement dao: funded, votes, members github: forks, stars, issues discord: online, communicators, total newsletter: clicks, opens, subscribes website: duration, bounces, sessions youtube: views, watchtime, subscribers
social media twitter: impressions, profile visits, follows reddit: posts, views, followers facebook: engage, reach, followers telegram: messages, online, total others: medium, linkedin, instagram
developers github: contributors, closed issues, pull requests gitcoin: funded (eth), bounties, members downtime: mainnet, testnet, api (hours) teams: full time, part time, work hours api: request count, response time, clients
(Last Updated: 01/03/2022.)
Top Metrics


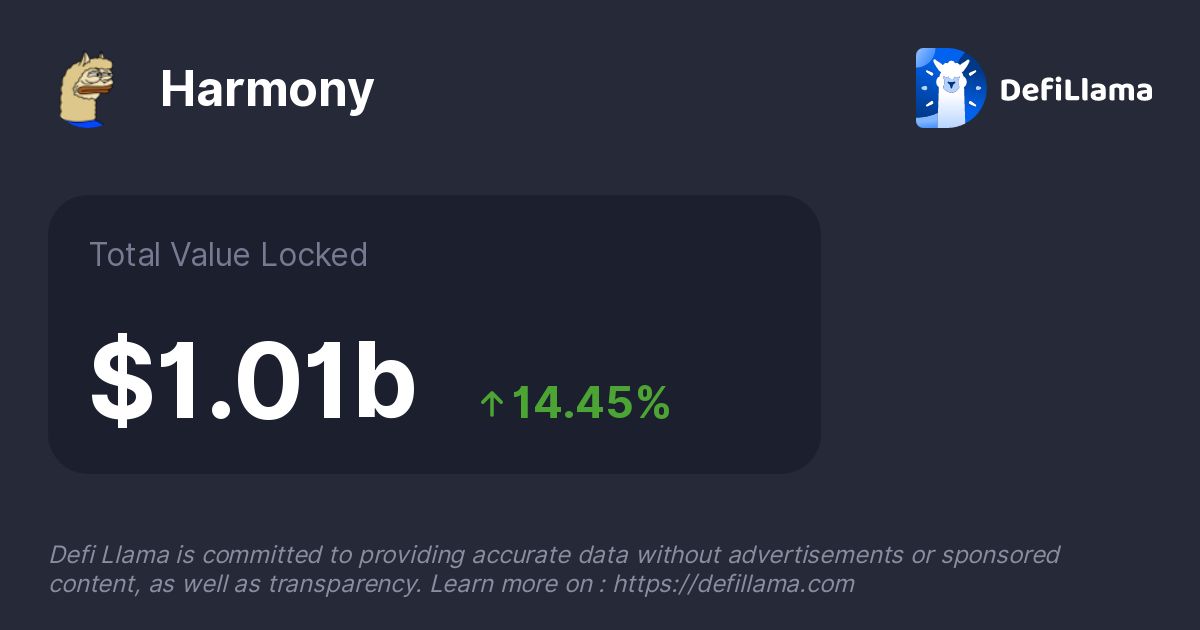
General Overview


http://supply.hmny.io:5000/circulating-supply
- https://coinmarketcap.com/currencies/harmony/historical-data/
- Jan 01, 2021 $0.004251 $0.004481 $0.004138 $0.004242 $6,099,059 $34,927,440
- Dec 31, 2021 $0.229 $0.2429 $0.2242 $0.234 $100,093,569 $2,707,372,206
- Jan 13, 2022 $0.3441 $0.364 $0.3335 $0.3479 $626,785,127 $4,031,443,152
- 01/01/2021 price: (high price + low price) / 2 = (0.004251 + 0.004481) / 2 = 0.004366
- 12/31/2021 price: (0.2429 + 0.229) / 2 = 0.23595
- 01/13/2022 price: (0.3441 + 0.364) / 2 = 0.35405, and total supply 13315165800
- 2021 market cap jump: dec’s cap / jan’s cap = 2707372206 / 34927440 = 77.5X
- 2021 price jump: dec’s price / jan’s price = 0.23595 / 0.004366 = 54.0X
http://supply.hmny.io:5000/circulating-supply on 01/13/2022 = 11586532800
- https://staking.harmony.one = 4,166,706,740 ONE staked
- 4166706740 staked / 11586532800 circulating = 36.0% staked
- 4166706740 staked * $0.35405 price = $1.48B staked
- market cap (valuation) = mid price * circulating supply = $0.35405 * 11586532800 = $4.10B
- full cap (fully diluted valuation) = mid price * total supply = $0.35405 * 13315165800 = $4.71B
- full cap jump: (today price * today’s total supply) / (jan’s price * jan’s total supply) = ?
- market cap jump: 4,031,443,152 / 2,707,372,206 = 1.49X
https://explorer-v2-api.hmny.io/v0/metrics/walletsCount14d (the number of wallets with non-zero balance)
- 2021-12-15: 514,924
- 2022-01-12: 656,420


Competitors (Market Analysis)


Consider Web 3.0 to be an executable Magna Carta — “the foundation of the freedom of the individual against the arbitrary authority of the despot.” Web 3.0, or as might be termed the "post-Snowden" web, is a reimagination of the sorts of things that we already use the Web for, but with a fundamentally different model for the interactions between parties. Information that we assume to be public, we publish. Information that we assume to be agreed, we place on a consensus-ledger. Information that we assume to be private, we keep secret and never reveal. Communication always takes place over encrypted channels and only with pseudonymous identities as endpoints; never with anything traceable (such as IP addresses). In short, we engineer the system to mathematically enforce our prior assumptions, since no government or organisation can reasonably be trusted.


It will be a race to solve the cross-chain problem.. we are beginning to see the rise of layer 0 and multichain ecosystems such as Cosmos and Polkadot. We now have $250b of TVL across over 80 chains. With so much value dispersed in different places, 2022 will be the year that projects race to effectively bridge assets between these chains with the smallest cost and friction to the user. While there are already some solutions, none have developed a seamless bridge.
Analytics & Fees


